The Interpersonal Reactivity Index (IRI) (Davis, 1983) is the standard multi-dimensional self-report measure of empathy. It distinguishes between cognitive and affective aspects of empathy across four subscales (each scored 0–28):
Subscale
Description
IRI_perspectiveTaking
Cognitive: spontaneous tendency to adopt others’ point of view
IRI_empathicConcern
Affective: other-oriented feelings of warmth and concern
IRI_fantasy
Tendency to imaginatively transpose into fictional characters
IRI_personalDistress
Self-oriented distress in response to others’ suffering
The IRI complements the MASC (film-based ToM) by capturing the self-reported empathic disposition. Both instruments may moderate strategic behaviour in the GTEMO games — see the MASC × IRI page for their joint analysis.
3 η² (Kruskal-Wallis). Small / medium / large: η² ≥ 0.01 / 0.06 / 0.14.
Note
Statistics are median (Q1, Q3). Kruskal-Wallis tests between games; η² effect sizes reported. Random assignment should yield comparable IRI profiles across conditions — any significant differences are relevant as potential confounders in subsequent analyses.
Cronbach’s α across the four IRI subscales reflects the internal consistency of the battery as a whole (treating subscales as items). The IRI was designed as a multi-dimensional instrument — low α across subscales is expected and appropriate when they capture distinct facets of empathy.
5 Conditioning on gender and role
Note
Distributions stratified by gender and role, followed by OLS models with game, gender, and role entered simultaneously. Reference category: game = BS, gender = Male, role = P1 (LEEN).
5.1 IRI by gender
Show code
p_iri_gender
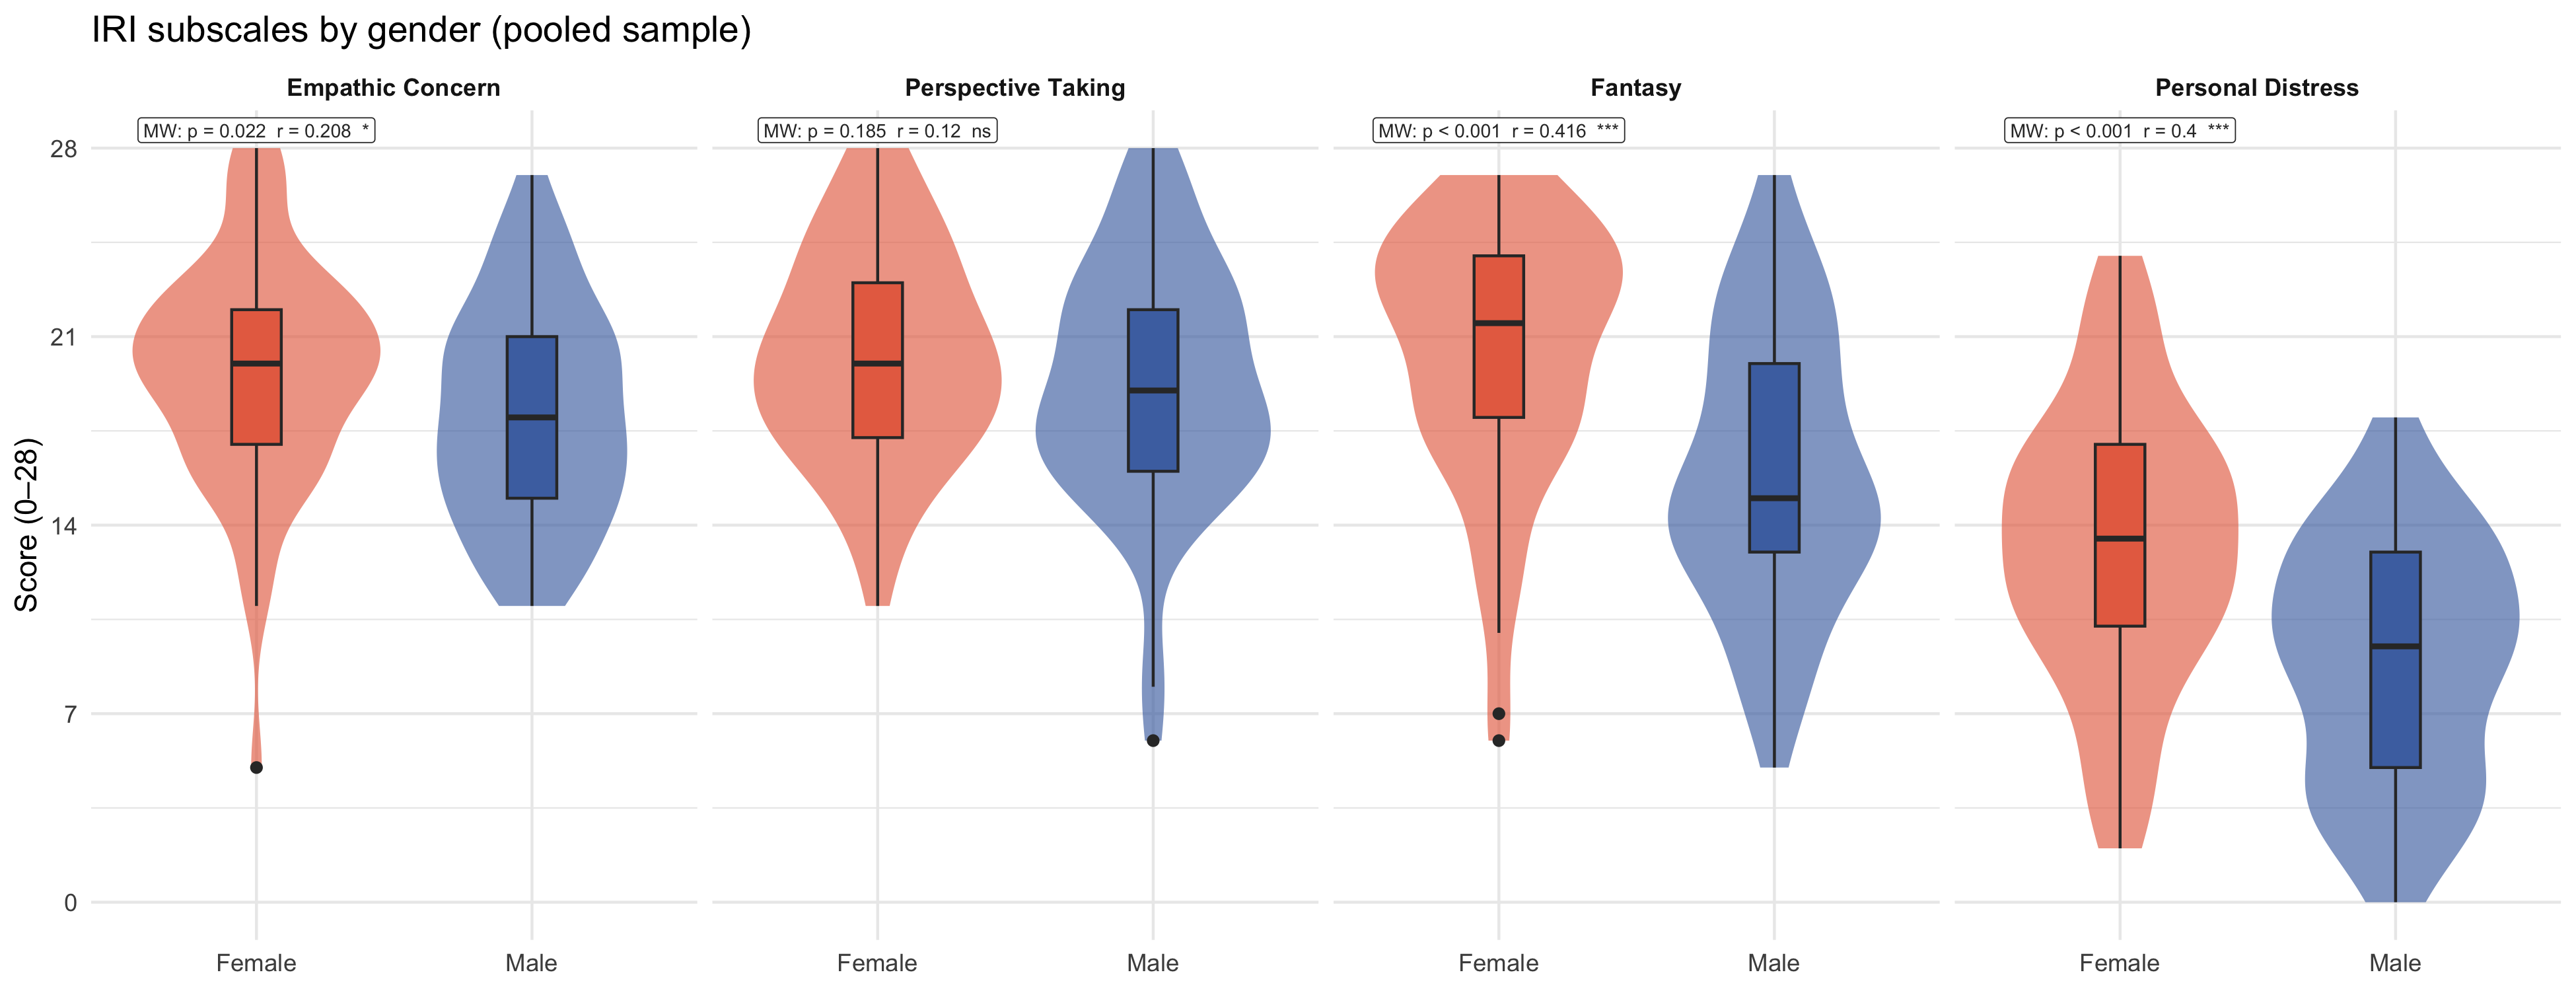
Figure 1: IRI four subscales by gender (pooled sample). All subscales on the same y-axis (0–28) for comparability. Mann-Whitney annotations per subscale.
Tip
Consistency with the IRI literature. The established meta-analytic finding is that women score higher than men on IRI subscales, with the most robust and largest effects on affective components (Empathic Concern, Personal Distress, Fantasy) and a weaker or non-significant effect on the cognitive component (Perspective Taking) — see e.g. Spreng et al. (2009), Eisenberg & Lennon (1983).
Our sample replicates this pattern precisely:
Personal Distress: Female median = 13.5 vs Male = 9.5 — MW r = +0.46, p < .001 (***)
Fantasy: Female median = 21.5 vs Male = 15.0 — MW r = +0.48, p < .001 (***)
Empathic Concern: Female median = 20.0 vs Male = 18.0 — MW r = +0.24, p = .022 (*)
Perspective Taking: Female median = 20.0 vs Male = 19.0 — MW r = +0.14, p = .186 (ns)
The affective–cognitive dissociation is confirmed: the three affective subscales show significant female advantage with moderate-to-large effect sizes, while Perspective Taking shows a small, non-significant trend in the same direction. This is consistent with the meta-analytic consensus and supports the validity of the IRI data in our sample.
5.2 IRI by role
Show code
p_iri_role
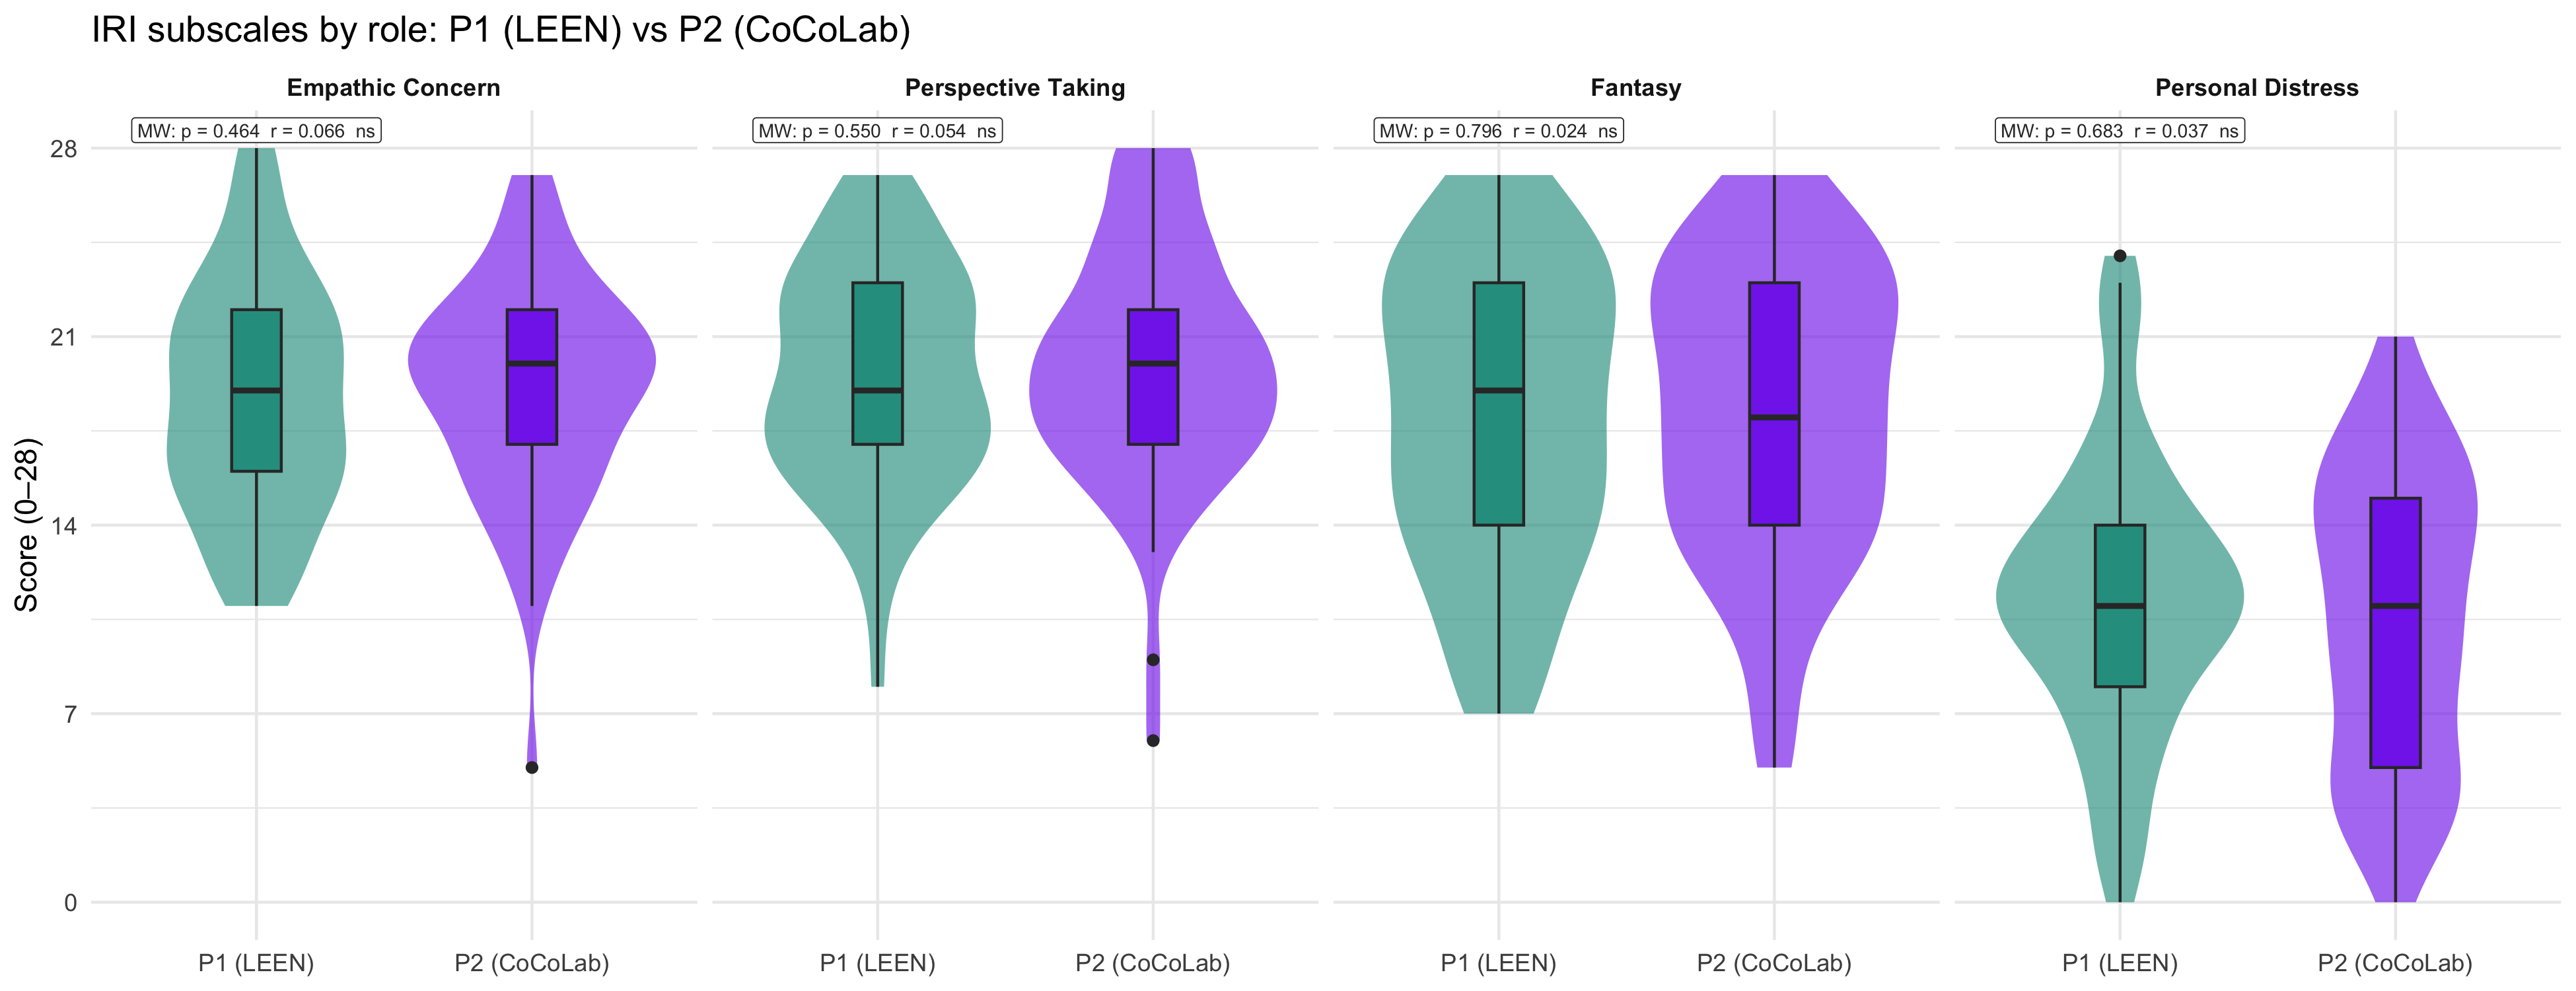
Figure 2: IRI four subscales by experimental role: P1 (LEEN) vs P2 (CoCoLab), pooled across games.
5.3 OLS with demographic controls
Show code
gt_ols_iri
OLS: IRI subscales ~ game + gender + role
OLS. Reference: game = BS, gender = Male, role = P1 (LEEN). 95% CI from confint().
Outcome
Predictor
β
SE
95% CI lo
95% CI hi
t
p
Sig.
Outcome: Personal Distress
Personal Distress
Game: MP vs BS
-1.243
1.243
-3.705
1.218
-1.000
0.319
Personal Distress
Game: PD vs BS
-0.664
1.267
-3.173
1.845
-0.524
0.601
Personal Distress
Game: SH vs BS
-0.688
1.222
-3.109
1.734
-0.562
0.575
Personal Distress
genderMale
-4.265
0.888
-6.024
-2.506
-4.804
< 0.001
***
Personal Distress
Role: CoCoLab vs LEEN
-0.738
0.885
-2.491
1.016
-0.833
0.406
Outcome: Fantasy
Fantasy
Game: MP vs BS
-1.310
1.273
-3.832
1.212
-1.029
0.306
Fantasy
Game: PD vs BS
1.086
1.298
-1.484
3.656
0.837
0.404
Fantasy
Game: SH vs BS
-1.375
1.252
-3.855
1.105
-1.098
0.274
Fantasy
genderMale
-4.450
0.909
-6.252
-2.649
-4.893
< 0.001
***
Fantasy
Role: CoCoLab vs LEEN
0.262
0.907
-1.534
2.058
0.289
0.773
Outcome: Perspective Taking
Perspective Taking
Game: MP vs BS
1.577
1.087
-0.576
3.729
1.451
0.149
Perspective Taking
Game: PD vs BS
0.307
1.108
-1.886
2.501
0.277
0.782
Perspective Taking
Game: SH vs BS
0.781
1.069
-1.335
2.898
0.731
0.466
Perspective Taking
genderMale
-1.114
0.776
-2.651
0.424
-1.435
0.154
Perspective Taking
Role: CoCoLab vs LEEN
0.443
0.774
-1.090
1.976
0.572
0.569
Outcome: Empathic Concern
Empathic Concern
Game: MP vs BS
-0.144
1.056
-2.235
1.947
-0.136
0.892
Empathic Concern
Game: PD vs BS
0.549
1.076
-1.582
2.680
0.510
0.611
Empathic Concern
Game: SH vs BS
-0.719
1.038
-2.775
1.338
-0.692
0.49
Empathic Concern
genderMale
-1.625
0.754
-3.118
-0.131
-2.154
0.033
*
Empathic Concern
Role: CoCoLab vs LEEN
0.377
0.752
-1.112
1.866
0.501
0.617
β = OLS coefficient. * p < .05 ** p < .01 *** p < .001.
Show code
p_forest_iri8
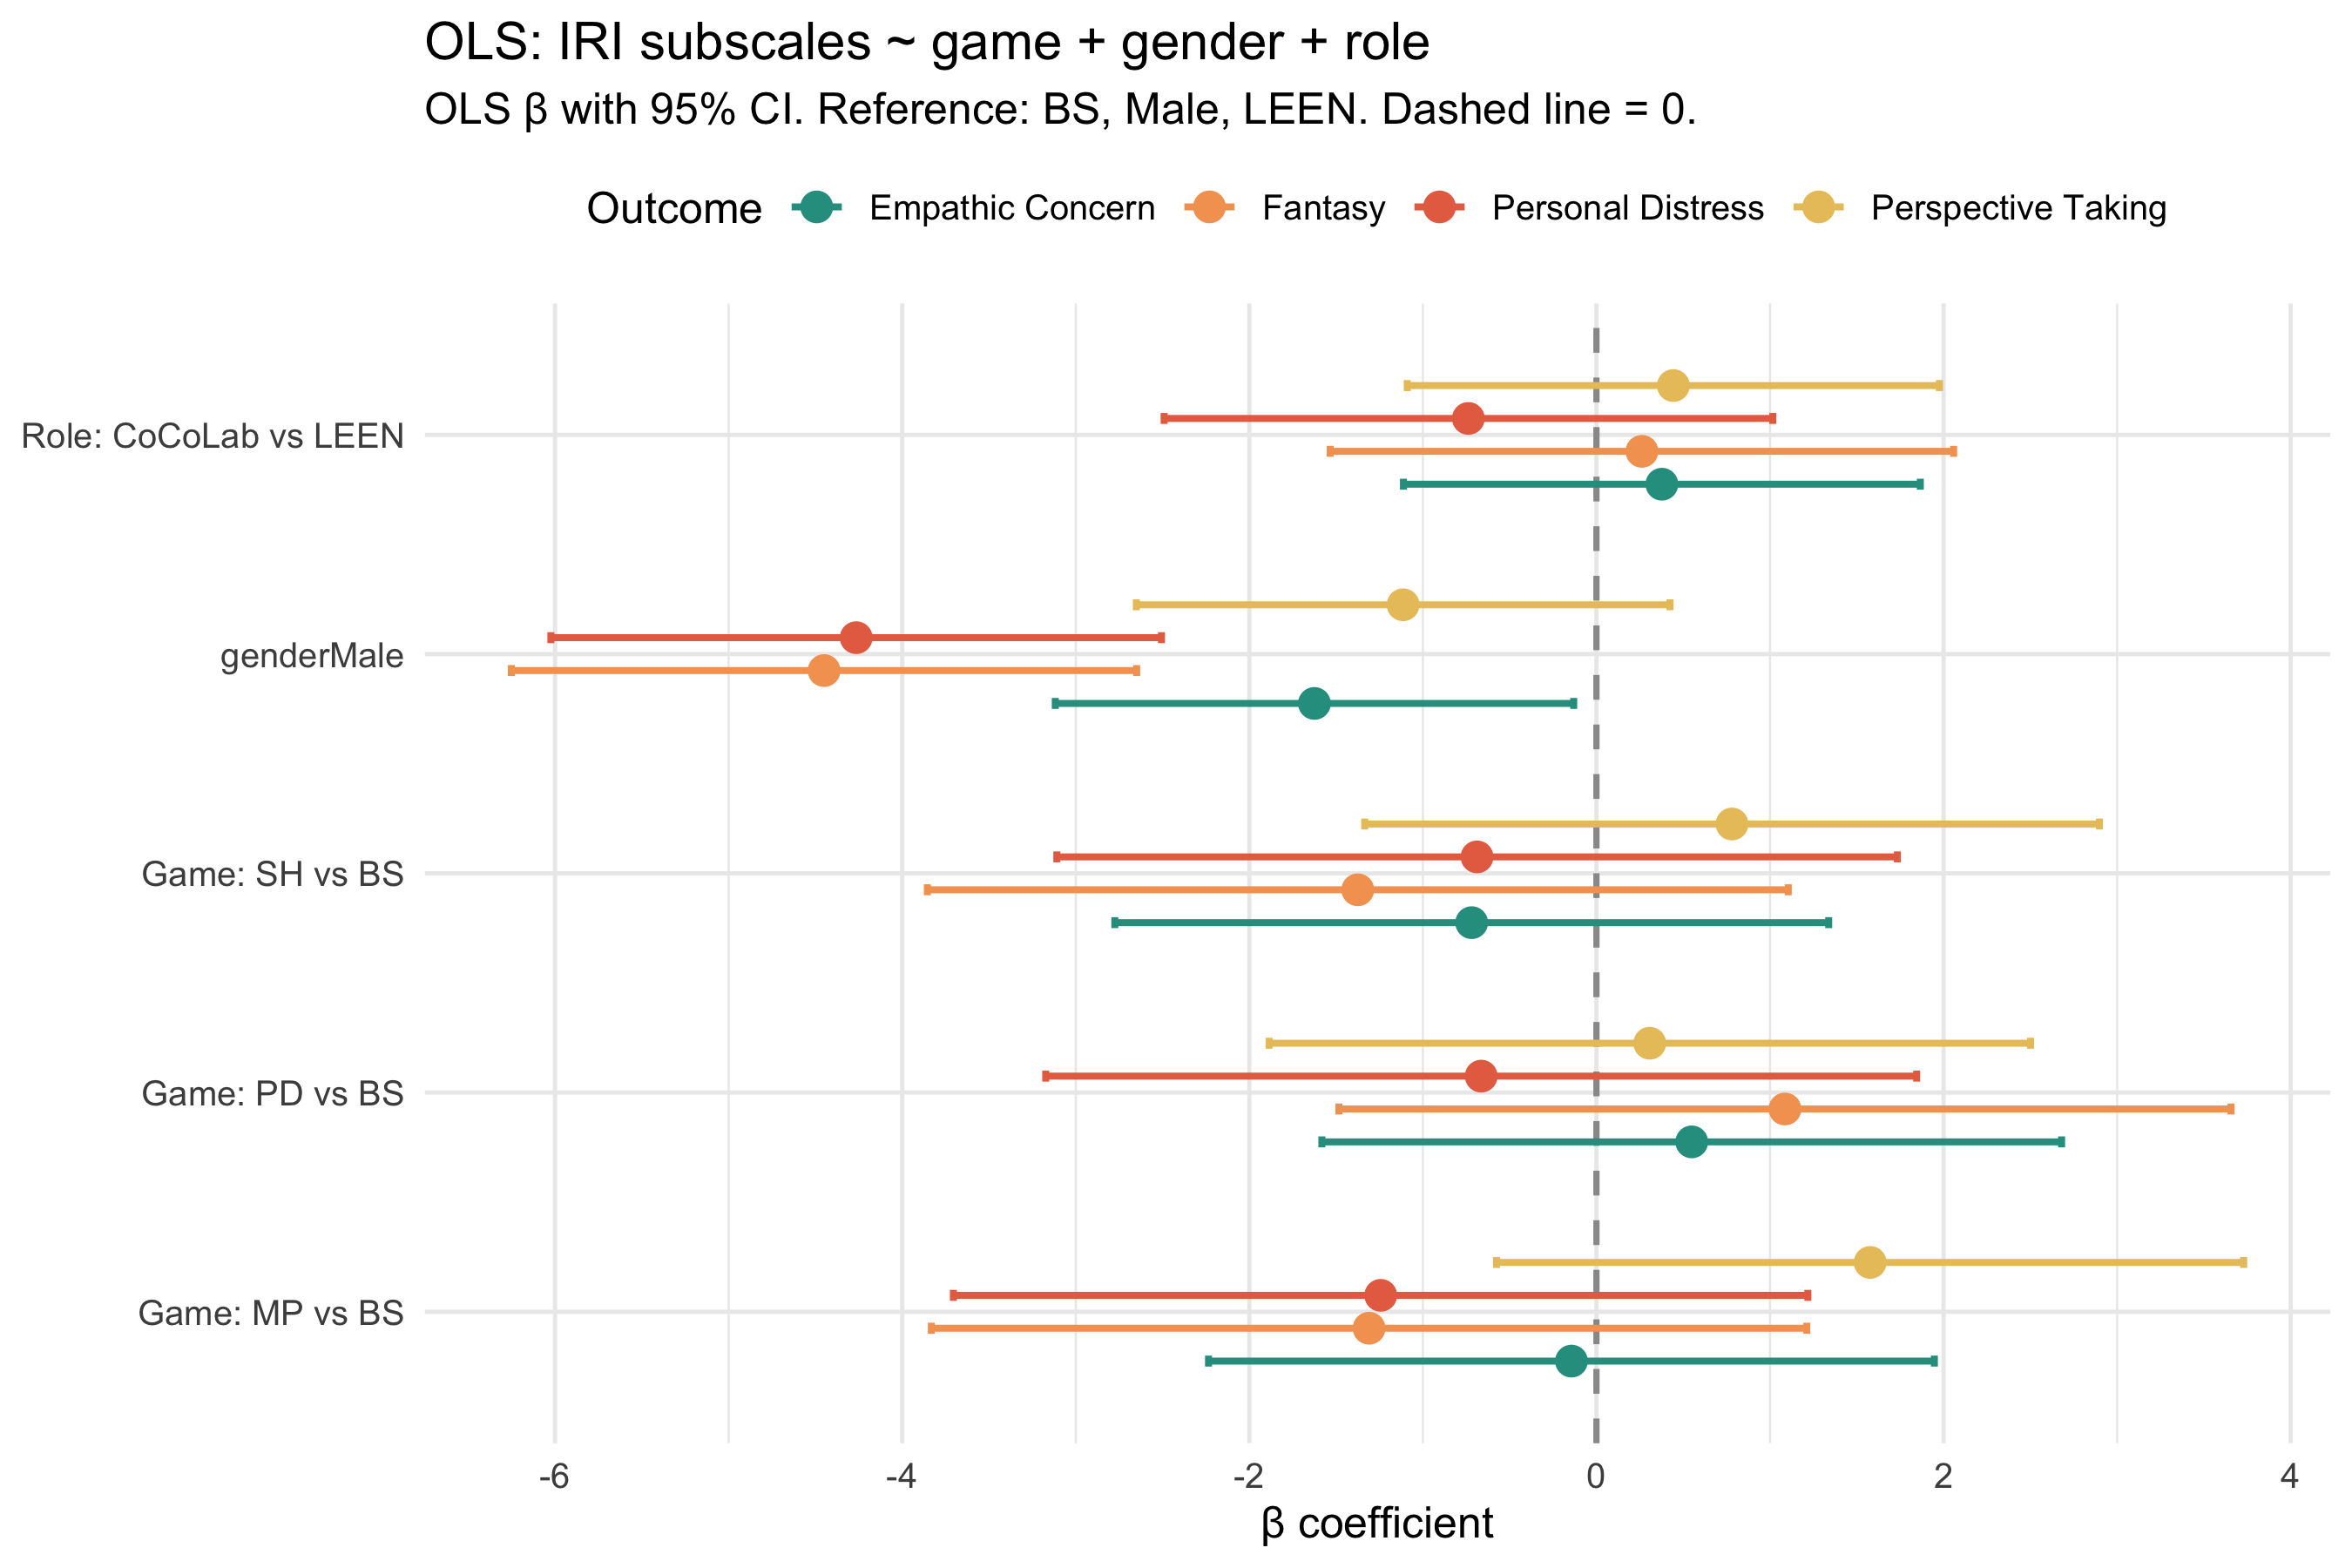
Figure 3: Forest plot: OLS β with 95% CI for IRI subscales (game + gender + role). Game effects (vs BS), gender (Female vs Male), and role (CoCoLab vs LEEN) shown side by side.
Note
Interpretation. Game coefficients represent the conditional effect of game assignment given equal gender and role composition. Gender or role coefficients reveal systematic differences in IRI scores attributable to those characteristics, independent of game condition.
6 Response times
6.1 IRI: time spent vs all subscales
Show code
p_iri_speed_panel
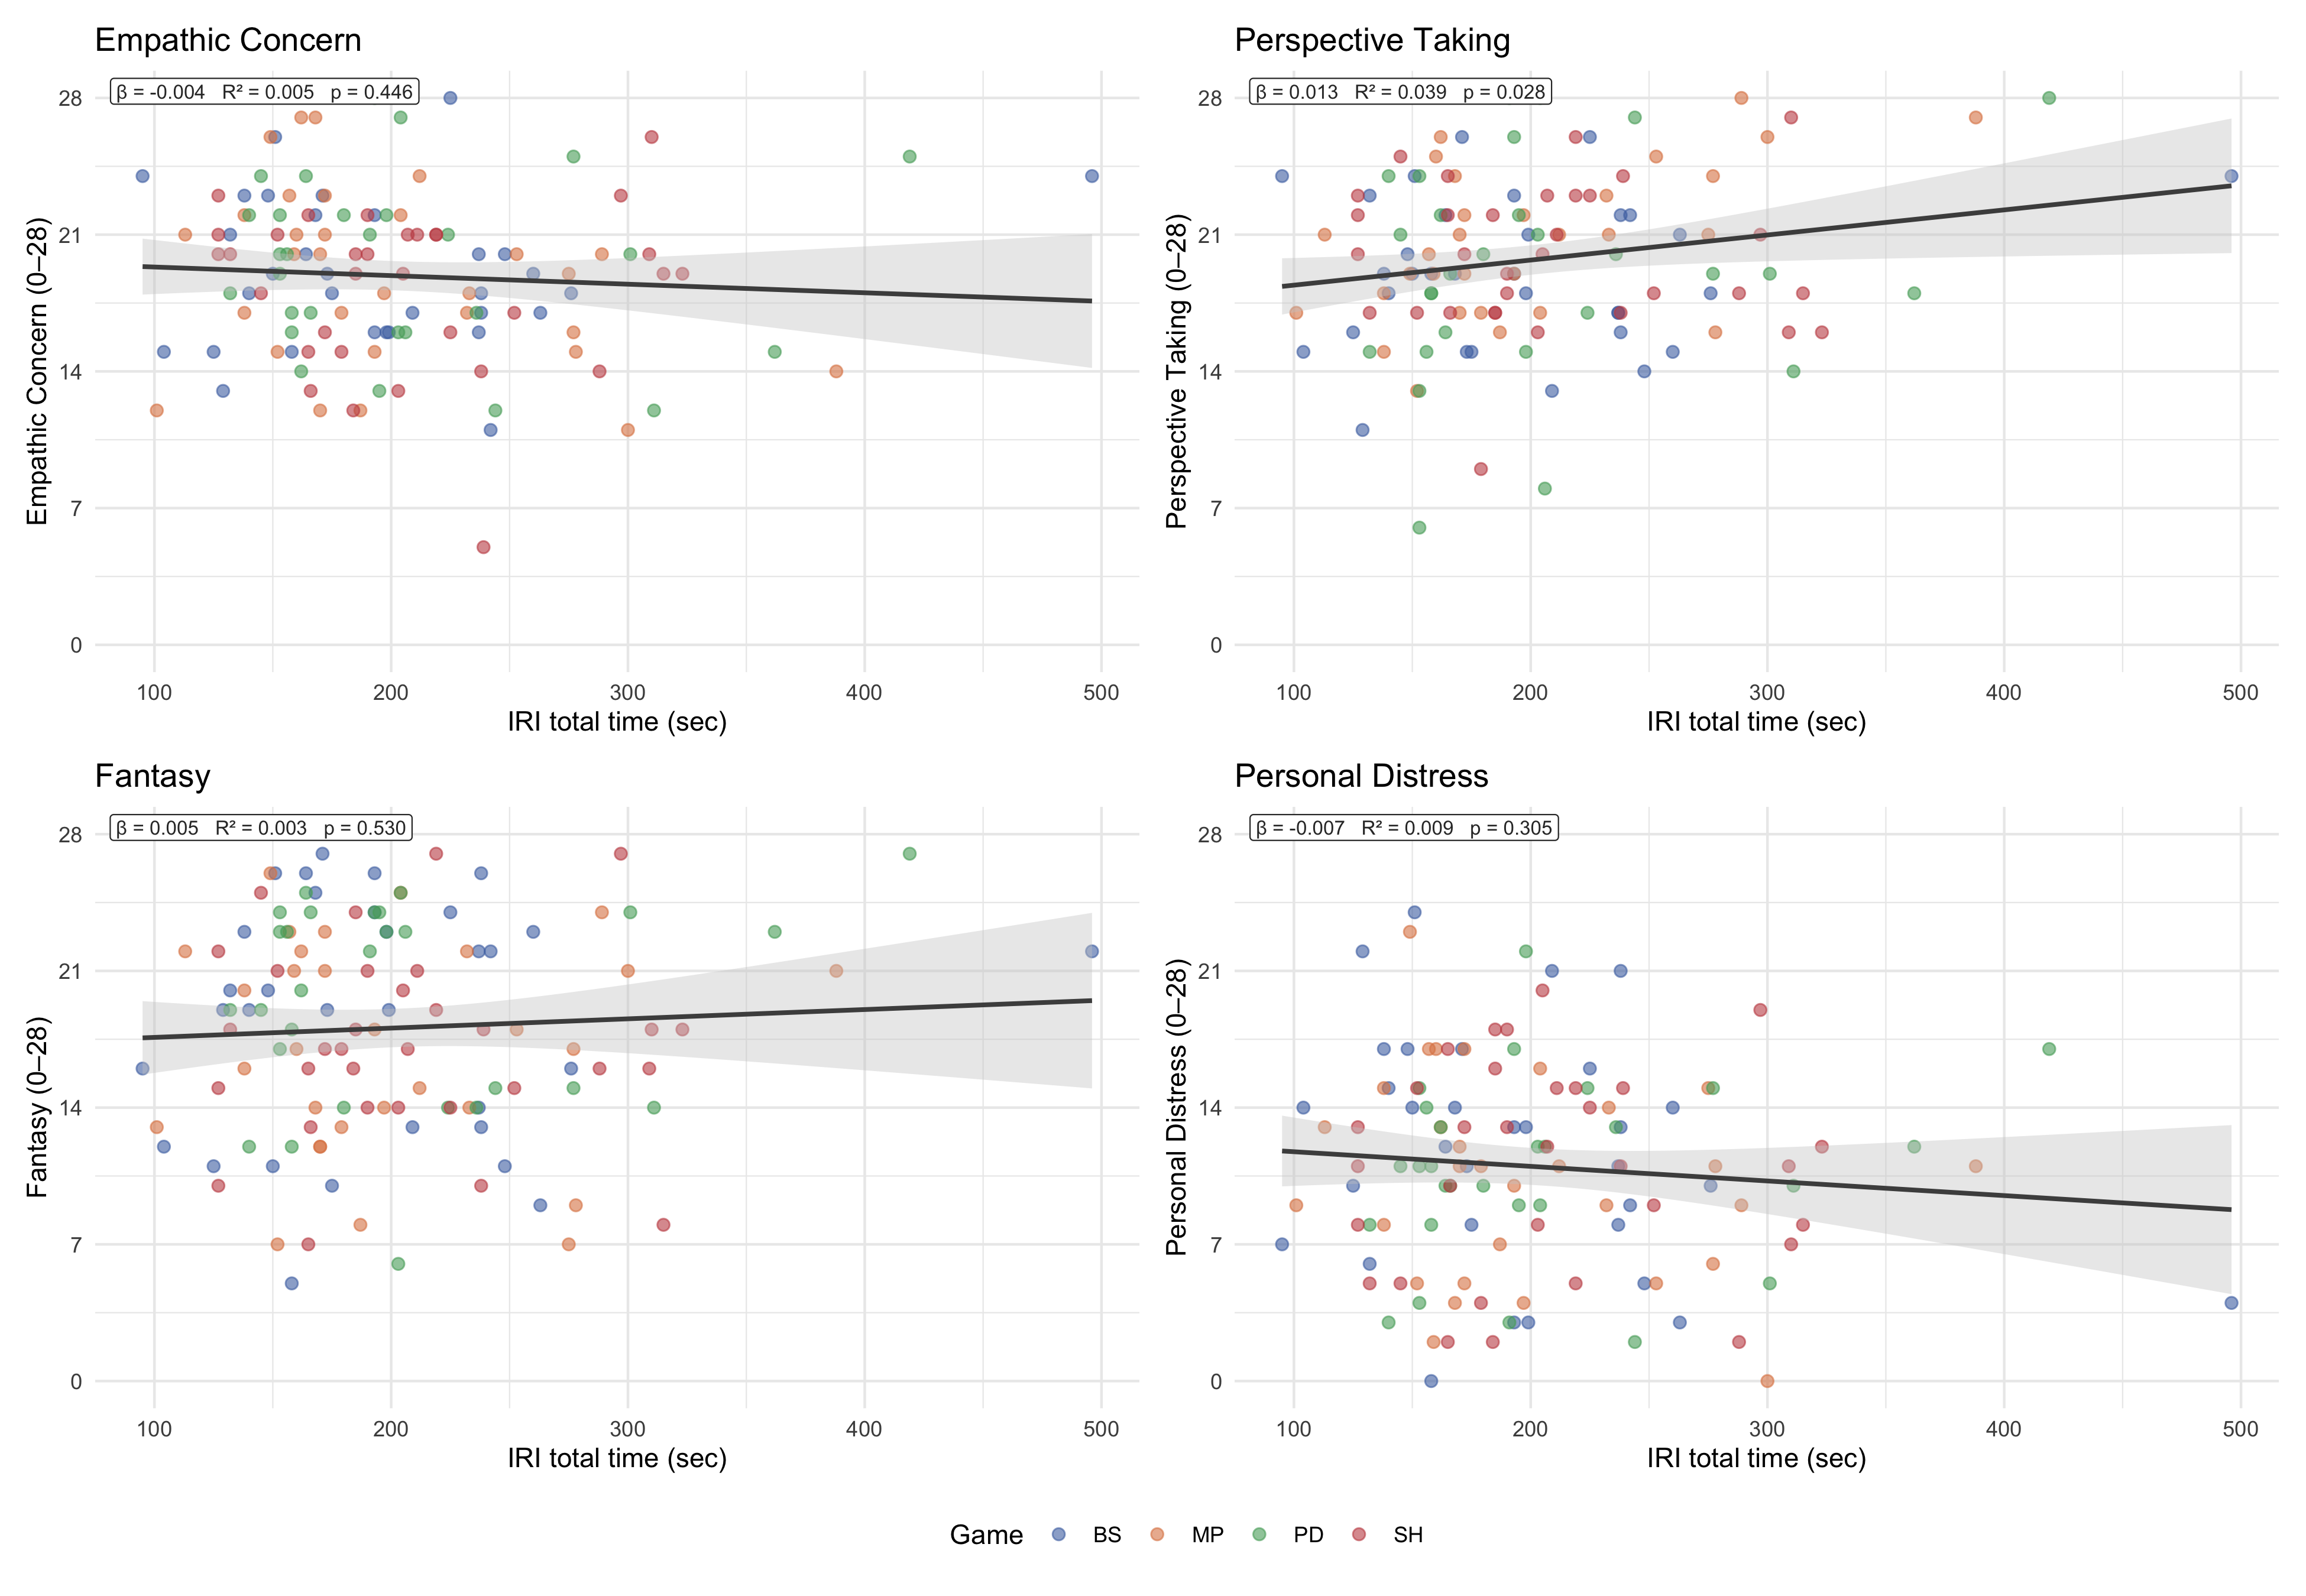
Figure 4: IRI total completion time vs each of the four subscales (Empathic Concern, Perspective Taking, Fantasy, Personal Distress). OLS line with 95% CI; annotation reports β, R², p-value. Points coloured by game.
7 Preliminary interpretation
For the IRI, randomly assigned groups should show comparable empathy profiles. Significant game differences would flag imbalance that warrants covariate adjustment in the main analyses.
Gender and role effects in the OLS models reveal whether self-reported empathic dispositions vary systematically across the two laboratories (LEEN vs CoCoLab) and between male and female participants — a relevant baseline check given the social nature of the GTEMO games.
Source Code
---title: "IRI"subtitle: "Interpersonal Reactivity Index · GTEMO Experiment"author: "Eric Guerci"date: todayformat: html: theme: flatly toc: true toc-depth: 3 toc-title: "Contents" number-sections: true code-fold: true code-summary: "Show code" code-tools: true fig-width: 10 fig-height: 6 fig-dpi: 150 smooth-scroll: trueexecute: echo: true warning: false message: false---```{r setup}#| include: falselibrary(tidyverse)library(gtsummary)library(gt)library(ggplot2)library(patchwork)library(scales)library(rstatix)library(skimr)library(psych)df <-read.csv("../../../data/df_individual_all.csv") |>mutate(game_id =factor(game_id, levels =c("BS","MP","PD","SH")),gender =factor(gender_dummy, levels =c(0, 1), labels =c("Female", "Male")), # 0=Femme, 1=Hommerole =factor(SINFO_role, levels =c(1, 2), labels =c("P1 (LEEN)", "P2 (CoCoLab)")) )col_game <-c("BS"="#4C72B0", "MP"="#DD8452","PD"="#55A868", "SH"="#C44E52")source("code.R")```## BackgroundThe **Interpersonal Reactivity Index (IRI)** (Davis, 1983) is the standard multi-dimensional self-report measure of empathy. It distinguishes between cognitive and affective aspects of empathy across four subscales (each scored 0–28):| Subscale | Description ||----------|-------------||`IRI_perspectiveTaking`| Cognitive: spontaneous tendency to adopt others' point of view ||`IRI_empathicConcern`| Affective: other-oriented feelings of warmth and concern ||`IRI_fantasy`| Tendency to imaginatively transpose into fictional characters ||`IRI_personalDistress`| Self-oriented distress in response to others' suffering |The IRI complements the MASC (film-based ToM) by capturing the *self-reported* empathic disposition. Both instruments may moderate strategic behaviour in the GTEMO games — see the **MASC × IRI** page for their joint analysis.## Data overview```{r}#| label: iri-overview#| tbl-cap: "Descriptive skim of IRI subscale scores."df |>select(game_id, IRI_perspectiveTaking, IRI_empathicConcern, IRI_fantasy, IRI_personalDistress) |>skim()```## Descriptive statistics by game```{r}#| label: tab-iritab_iri```::: callout-noteStatistics are median (Q1, Q3). Kruskal-Wallis tests between games; η² effect sizes reported. Random assignment should yield comparable IRI profiles across conditions — any significant differences are relevant as potential confounders in subsequent analyses.:::## Internal consistencyCronbach's α for the four-subscale battery:```{r}#| label: iri-alphaprint(iri_alpha, digits =3)```::: callout-noteCronbach's α across the four IRI subscales reflects the internal consistency of the *battery as a whole* (treating subscales as items). The IRI was designed as a multi-dimensional instrument — low α across subscales is expected and appropriate when they capture distinct facets of empathy.:::## Conditioning on gender and role::: callout-noteDistributions stratified by gender and role, followed by OLS models with game, gender, and role entered simultaneously. Reference category: game = BS, gender = Male, role = P1 (LEEN).:::### IRI by gender```{r}#| label: fig-iri-gender#| fig-cap: "IRI four subscales by gender (pooled sample). All subscales on the same y-axis (0–28) for comparability. Mann-Whitney annotations per subscale."#| fig-width: 13#| fig-height: 5p_iri_gender```::: callout-tip**Consistency with the IRI literature.** The established meta-analytic finding is that women score higher than men on IRI subscales, with the most robust and largest effects on **affective** components (Empathic Concern, Personal Distress, Fantasy) and a weaker or non-significant effect on the **cognitive** component (Perspective Taking) — see e.g. Spreng et al. (2009), Eisenberg & Lennon (1983).Our sample replicates this pattern precisely:- **Personal Distress**: Female median = 13.5 vs Male = 9.5 — MW *r* = +0.46, *p* < .001 (***)- **Fantasy**: Female median = 21.5 vs Male = 15.0 — MW *r* = +0.48, *p* < .001 (***)- **Empathic Concern**: Female median = 20.0 vs Male = 18.0 — MW *r* = +0.24, *p* = .022 (*)- **Perspective Taking**: Female median = 20.0 vs Male = 19.0 — MW *r* = +0.14, *p* = .186 (ns)The affective–cognitive dissociation is confirmed: the three affective subscales show significant female advantage with moderate-to-large effect sizes, while Perspective Taking shows a small, non-significant trend in the same direction. This is consistent with the meta-analytic consensus and supports the validity of the IRI data in our sample.:::### IRI by role```{r}#| label: fig-iri-role#| fig-cap: "IRI four subscales by experimental role: P1 (LEEN) vs P2 (CoCoLab), pooled across games."#| fig-width: 13#| fig-height: 5p_iri_role```### OLS with demographic controls```{r}#| label: tab-ols-irigt_ols_iri``````{r}#| label: fig-forest-iri8#| fig-cap: "Forest plot: OLS β with 95% CI for IRI subscales (game + gender + role). Game effects (vs BS), gender (Female vs Male), and role (CoCoLab vs LEEN) shown side by side."#| fig-width: 9#| fig-height: 6p_forest_iri8```::: callout-note**Interpretation.** Game coefficients represent the conditional effect of game assignment given equal gender and role composition. Gender or role coefficients reveal systematic differences in IRI scores attributable to those characteristics, independent of game condition.:::## Response times### IRI: time spent vs all subscales```{r}#| label: fig-iri-speed-panel#| fig-cap: "IRI total completion time vs each of the four subscales (Empathic Concern, Perspective Taking, Fantasy, Personal Distress). OLS line with 95% CI; annotation reports β, R², p-value. Points coloured by game."#| fig-width: 13#| fig-height: 9p_iri_speed_panel```## Preliminary interpretationFor the IRI, randomly assigned groups should show comparable empathy profiles. Significant game differences would flag imbalance that warrants covariate adjustment in the main analyses.Gender and role effects in the OLS models reveal whether self-reported empathic dispositions vary systematically across the two laboratories (LEEN vs CoCoLab) and between male and female participants — a relevant baseline check given the social nature of the GTEMO games.