Characterise the demographic composition of the sample and verify balance across the 4 game conditions (BS, MP, PD, SH). This section covers participant characteristics only; cognitive and psychological measures (MASC, IRI) are in Ib, and task performance (CRT, quiz comprehension) is in Id.
Categorical variables tested with χ² (Cramér’s V); continuous with Kruskal-Wallis (η²).
Show code
tab_balance
Characteristic
Overall
N = 1221
BS
N = 321
MP
N = 301
PD
N = 281
SH
N = 321
p-value2
Effect size3
Gender
0.938
V = 0.058
Male
58 (48%)
16 (50%)
14 (47%)
12 (43%)
16 (50%)
Female
64 (52%)
16 (50%)
16 (53%)
16 (57%)
16 (50%)
Experimental role
>0.999
V = 0
P1 (LEEN)
61 (50%)
16 (50%)
15 (50%)
14 (50%)
16 (50%)
P2 (CoCoLab)
61 (50%)
16 (50%)
15 (50%)
14 (50%)
16 (50%)
Age (midpoint)
0.319
V = 0.169
18.5
41 (34%)
16 (50%)
6 (21%)
8 (29%)
11 (34%)
22.5
60 (50%)
9 (28%)
18 (62%)
15 (54%)
18 (56%)
26.5
16 (13%)
6 (19%)
4 (14%)
4 (14%)
2 (6.3%)
30.5
4 (3.3%)
1 (3.1%)
1 (3.4%)
1 (3.6%)
1 (3.1%)
Education level
0.058
V = 0.212
Licence
71 (58%)
21 (66%)
11 (37%)
17 (61%)
22 (69%)
Master
42 (34%)
9 (28%)
14 (47%)
11 (39%)
8 (25%)
PhD
2 (1.6%)
1 (3.1%)
0 (0%)
0 (0%)
1 (3.1%)
Autre
7 (5.7%)
1 (3.1%)
5 (17%)
0 (0%)
1 (3.1%)
1 n (%)
2 Pearson’s Chi-squared test
3 Continuous: η² (Kruskal-Wallis). Categorical: Cramér’s V (χ²).
Note
A significant p-value indicates imbalance between game conditions for that variable. Imbalanced variables should be considered as covariates in subsequent inferential analyses.
4 Figures
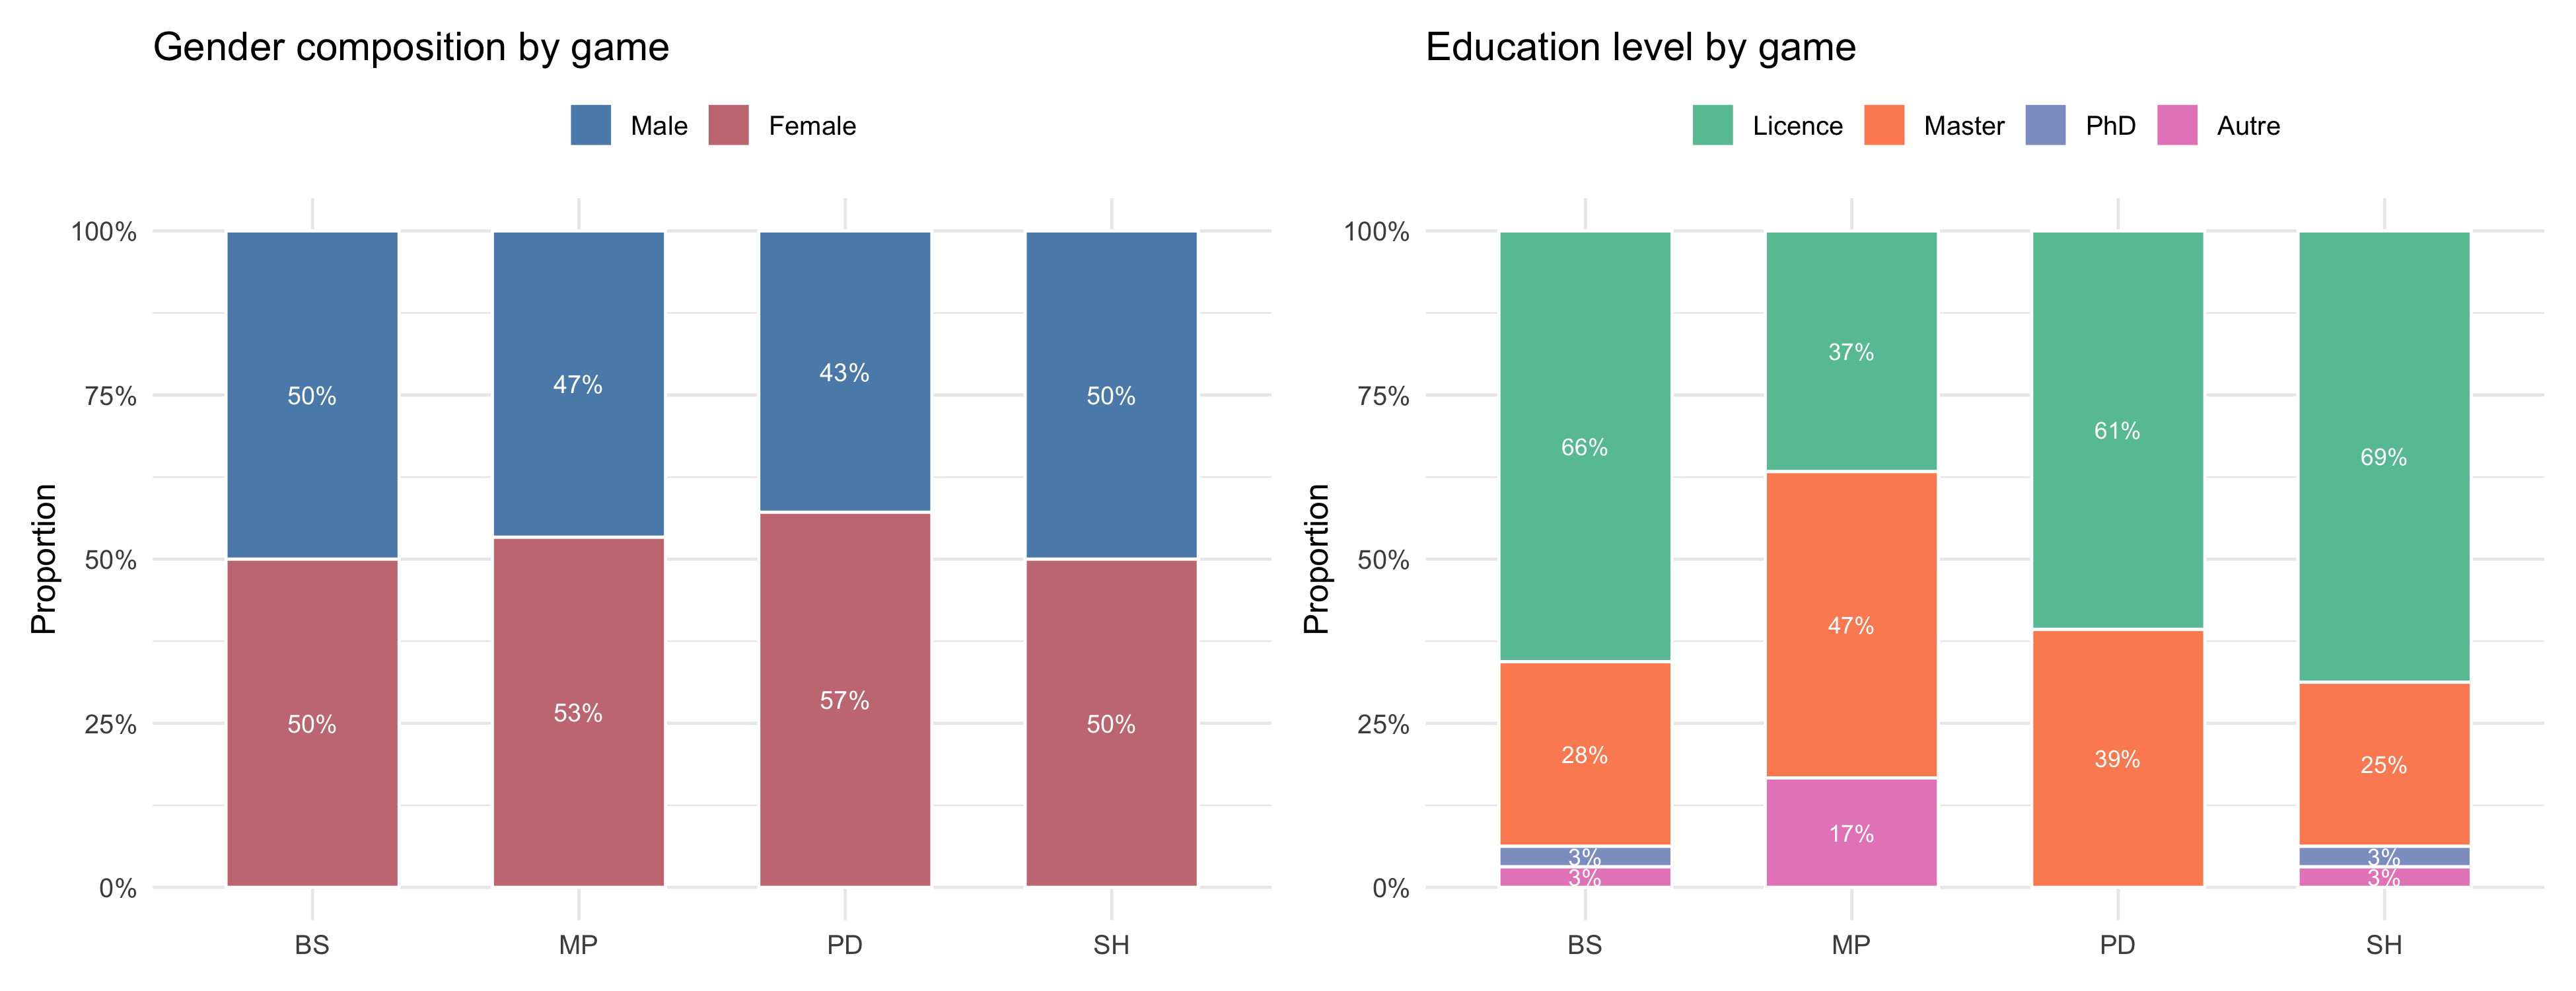
4.1 Gender and education
Show code
p_gender + p_edu +plot_layout(widths =c(1, 1))
Figure 1: Sample composition by gender (left) and education level (right) for each game condition.
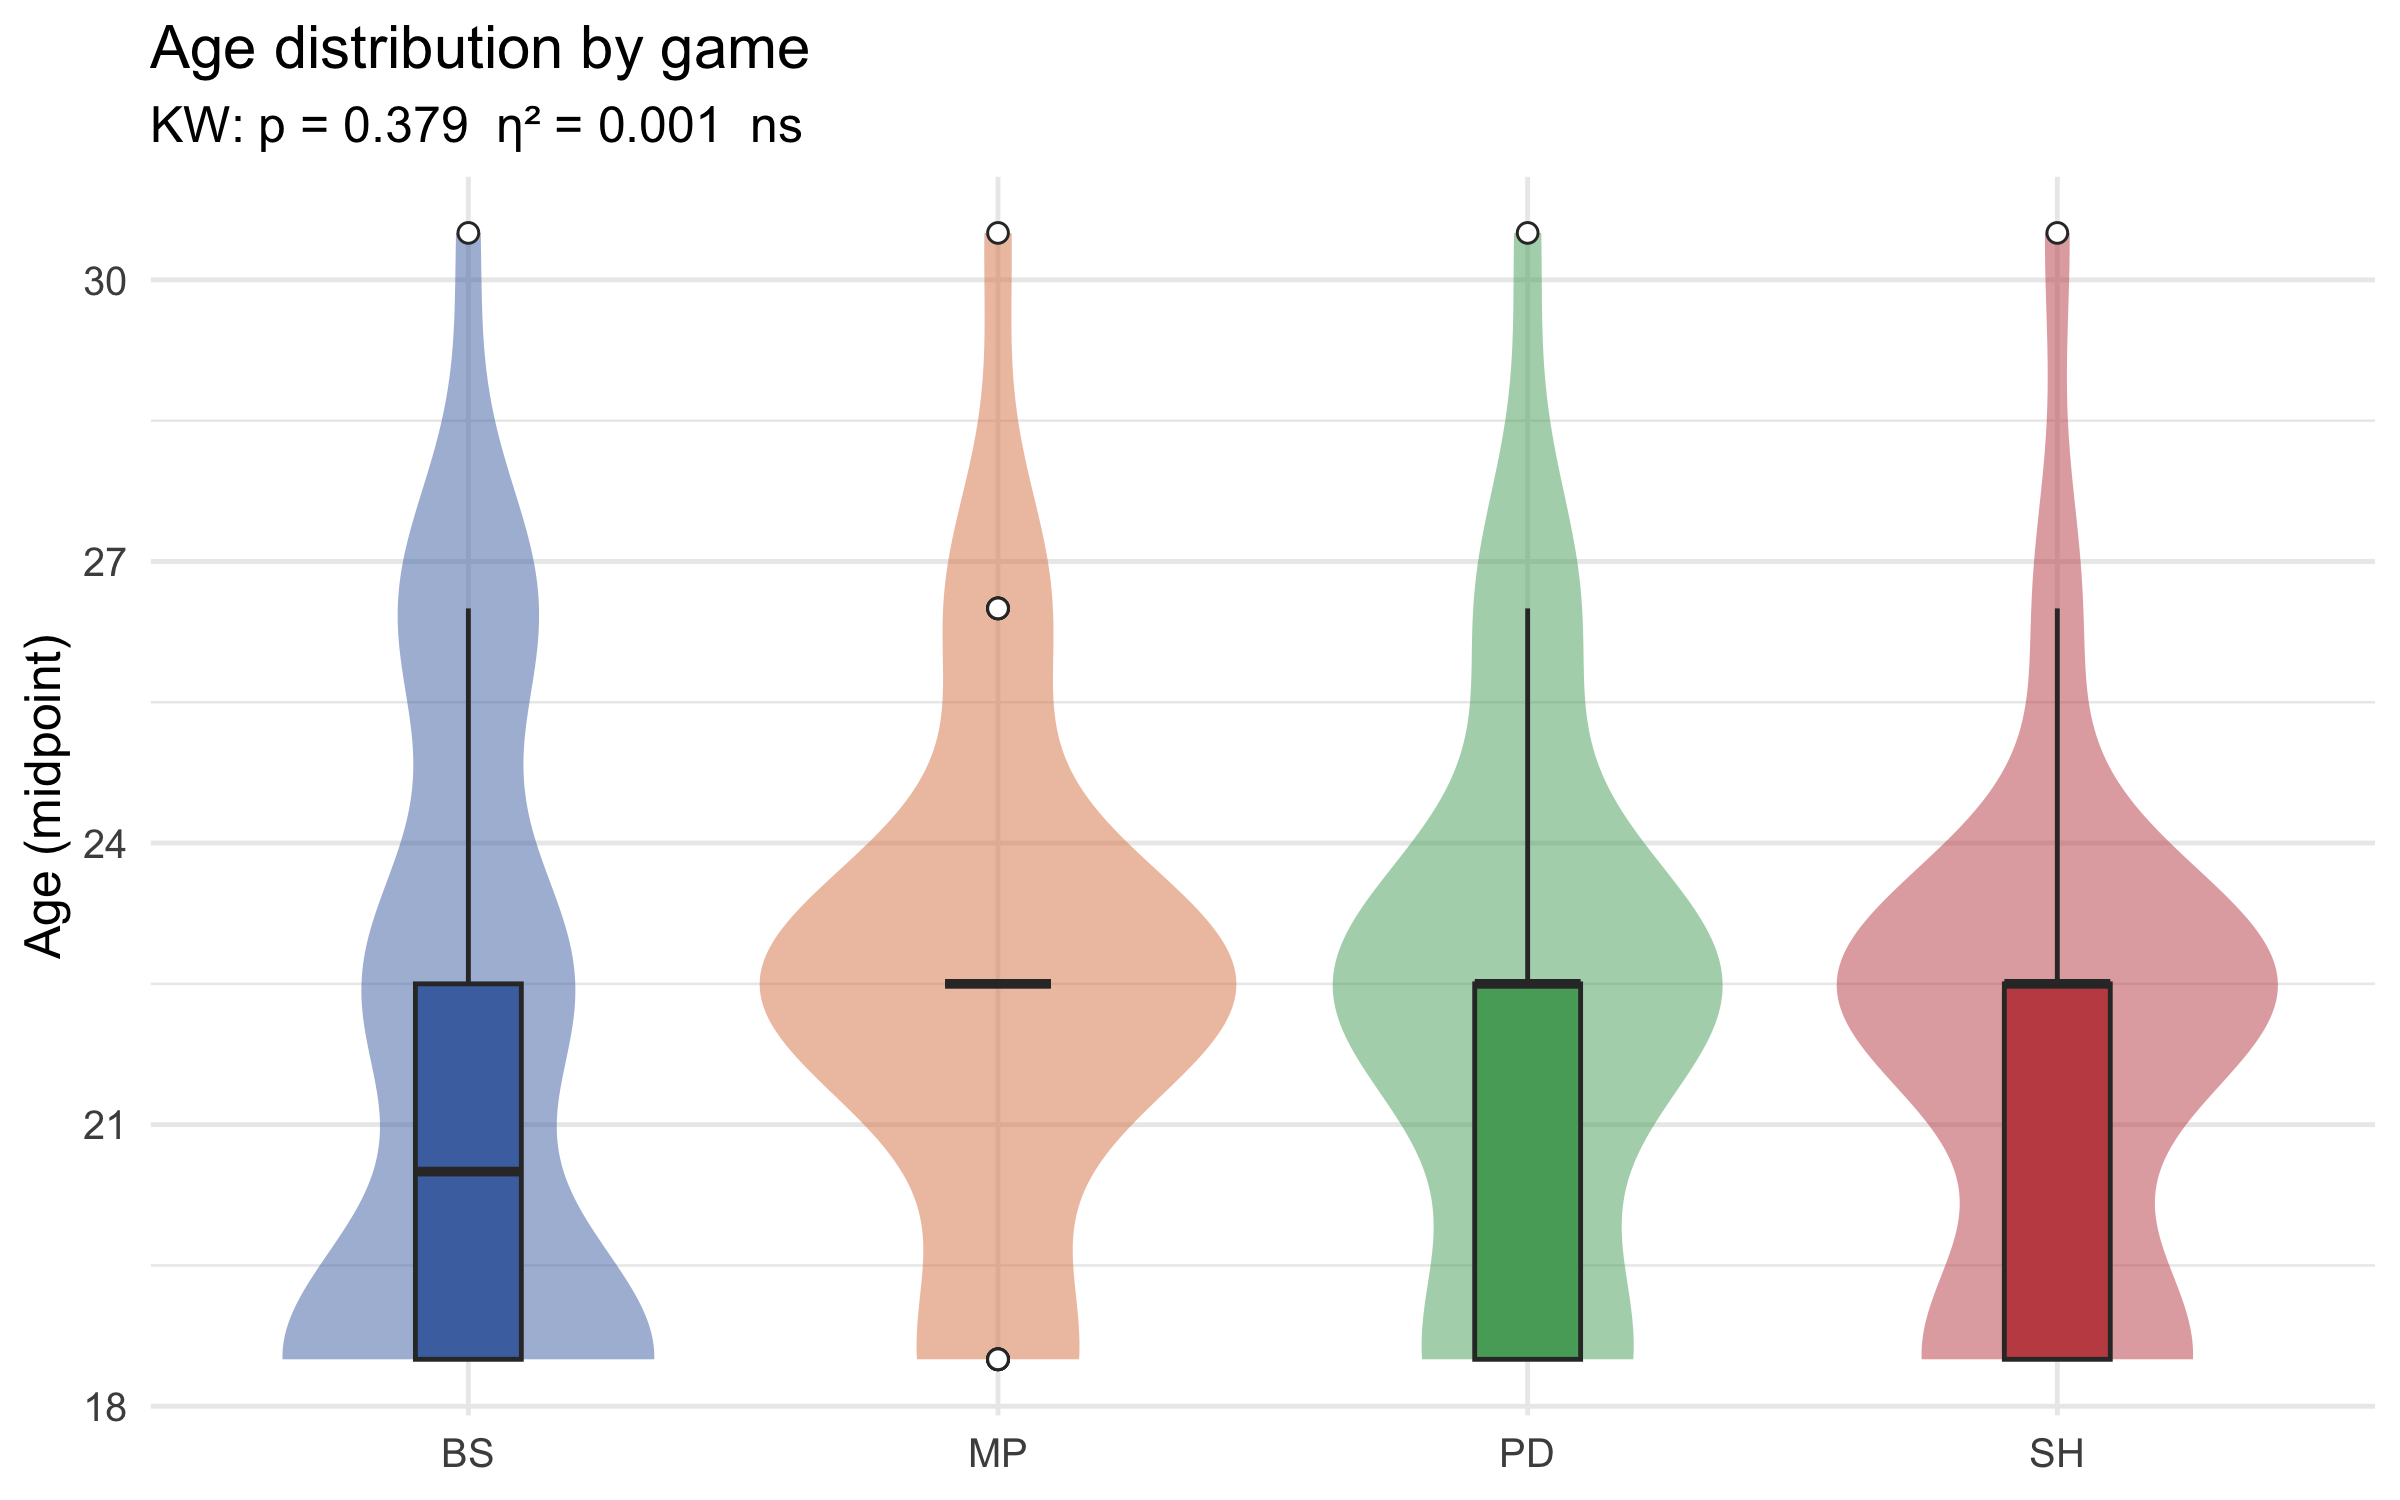
4.2 Age distribution
Show code
p_age
Figure 2: Age distribution by game condition (violin + boxplot). Points indicate individual observations.
5 Preliminary interpretation
The sample comprises 122 participants distributed across 4 experimental conditions (BS = 32, MP = 30, PD = 28, SH = 32). Median age is 22.5 years, consistent with a student/early-career academic sample.
No demographic variable shows a statistically significant imbalance across game conditions (p > 0.05 for all tests), supporting the validity of between-condition comparisons.
Source Code
---title: "Demographics"subtitle: "Descriptive Analyses · GTEMO Experiment"author: "Eric Guerci"date: todayformat: html: theme: flatly toc: true toc-depth: 3 toc-title: "Contents" number-sections: true code-fold: true code-summary: "Show code" code-tools: true fig-width: 10 fig-height: 5 fig-dpi: 150 smooth-scroll: trueexecute: echo: true warning: false message: false---```{r setup}#| include: falselibrary(tidyverse)library(gtsummary)library(gt)library(ggplot2)library(patchwork)library(scales)library(skimr)df <-read.csv("../../../data/df_individual_all.csv")df <- df |>mutate(game_id =factor(game_id, levels =c("BS","MP","PD","SH")),gender =factor(gender_dummy, levels =c(0,1), labels =c("Male","Female")),role =factor(SINFO_role, levels =c(1,2), labels =c("P1 (LEEN)","P2 (CoCoLab)")),edu_level =factor(education_level,levels =c("Licence","Master","PhD","Autre"),labels =c("Licence","Master","PhD","Autre")) )col_game <-c("BS"="#4C72B0", "MP"="#DD8452","PD"="#55A868", "SH"="#C44E52")source("code.R")```## ObjectiveCharacterise the **demographic composition** of the sample and verify **balance across the 4 game conditions** (BS, MP, PD, SH). This section covers participant characteristics only; cognitive and psychological measures (MASC, IRI) are in **Ib**, and task performance (CRT, quiz comprehension) is in **Id**.| Variable | Description ||---|---||`gender_dummy`| Gender (0 = Male, 1 = Female) ||`SINFO_role`| Experimental role (P1 = LEEN lab; P2 = CoCoLab) ||`age_midpoint`| Midpoint of reported age category ||`education_level`| Highest degree (Licence / Master / PhD / Autre) |## Data overview```{r}#| label: data-overviewdf |>select(game_id, gender, role, age_midpoint, edu_level) |> skimr::skim()```## Descriptive statistics### Full sample```{r}#| label: tab-overalltab_overall```### Balance by game conditionCategorical variables tested with **χ²** (Cramér's V); continuous with **Kruskal-Wallis** (η²).```{r}#| label: tab-balancetab_balance```::: callout-noteA significant p-value indicates **imbalance** between game conditions for that variable. Imbalanced variables should be considered as covariates in subsequent inferential analyses.:::## Figures### Gender and education```{r}#| label: fig-composition#| fig-cap: "Sample composition by gender (left) and education level (right) for each game condition."#| fig-width: 13#| fig-height: 5p_gender + p_edu +plot_layout(widths =c(1, 1))```### Age distribution```{r}#| label: fig-age#| fig-cap: "Age distribution by game condition (violin + boxplot). Points indicate individual observations."#| fig-width: 8#| fig-height: 5p_age```## Preliminary interpretation```{r}#| label: balance-check#| echo: falsepvals <- tab_balance$table_body |>filter(!is.na(p.value)) |>select(label, p.value) |>filter(p.value <0.05)```The sample comprises **`r nrow(df)` participants** distributed across 4 experimental conditions (BS = `r sum(df$game_id=="BS")`, MP = `r sum(df$game_id=="MP")`, PD = `r sum(df$game_id=="PD")`, SH = `r sum(df$game_id=="SH")`). Median age is **`r median(df$age_midpoint, na.rm=TRUE)` years**, consistent with a student/early-career academic sample.`r if(nrow(pvals) == 0) "No demographic variable shows a statistically significant imbalance across game conditions (p > 0.05 for all tests), supporting the validity of between-condition comparisons." else paste0("The following variables show significant imbalance across conditions: **", paste(pvals$label, collapse = ", "), "**. These should be treated as covariates in subsequent inferential analyses.")`